

Geography of protest events with H3 grid system
Geography of protest events with H3 grid system
A look back at 365 days of protests against gun violence in the U.S.

Welcome to another “daily” exploration of the discursus data. In this post, I want to answer the following 2 questions:
How can we improve the visualization of protest movement's location?
Can we better understand a protest movement by focusing on where events occurred?
See a live version of this Hex notebook.
For this exploration, I will take a deeper look at Gun Violence protest events that occurred in the United States in the past 365 days. I first query the discursus API:
select distinct
    eventPk,
    eventDate,
    actionGeoLatitude,
    actionGeoLongitude

from EventView

where eventDate > (now() - interval 365 day)
and movementName = 'Gun violence'
and actionGeoCountryName = 'united states'

order by eventDate
This returns 280 events.
To visualize their geography, we’ll be using Uber's H3 grid system to cluster events into geographical cells. There are multiple advantages to using H3, including zooming into cells at different resolutions. But do check out their release blog post, as well as their documentation website for more info.
Next, we create a function to convert our lat/long coordinates into H3 cells at specified resolutions.
# Convert lat/long coordinates into H3 cell at specified resolution
def lat_lng_to_h3(row, resolution):
    return h3.geo_to_h3(row["actionGeoLatitude"], row["actionGeoLongitude"], resolution)

# Convert h3 cell to WKT geometry for our maps
def h3_to_wkt(h3_cell):
    boundary = h3.h3_to_geo_boundary(h3_cell, geo_json=False)
    polygon = Polygon([(lng, lat) for lat, lng in boundary])
    return polygon.wkt

# Main function that uses input dataframe and counts events per H3 cell
def h3_cell_counts(my_df_events, my_resolution=3):
    my_df_events["h3_cell"] = my_df_events.apply(lambda row: lat_lng_to_h3(row, resolution=my_resolution), axis=1)

    df_h3_cell_counts = (my_df_events
        .groupby(['h3_cell'])
        .eventPk
        .agg(list)
        .to_frame("ids")
        .reset_index())

    df_h3_cell_counts['count'] =(df_h3_cell_counts['ids']
                        .apply(lambda df_events_h3_count:len(df_events_h3_count)))

    df_h3_cell_counts['wkt'] = df_h3_cell_counts['h3_cell'].apply(h3_to_wkt)

    return df_h3_cell_counts
Let's start with a low H3 resolution to get an overview of all Gun Violence related protest events in the US.
df_h3_cell_counts_res2 = h3_cell_counts(df_events, my_resolution=2)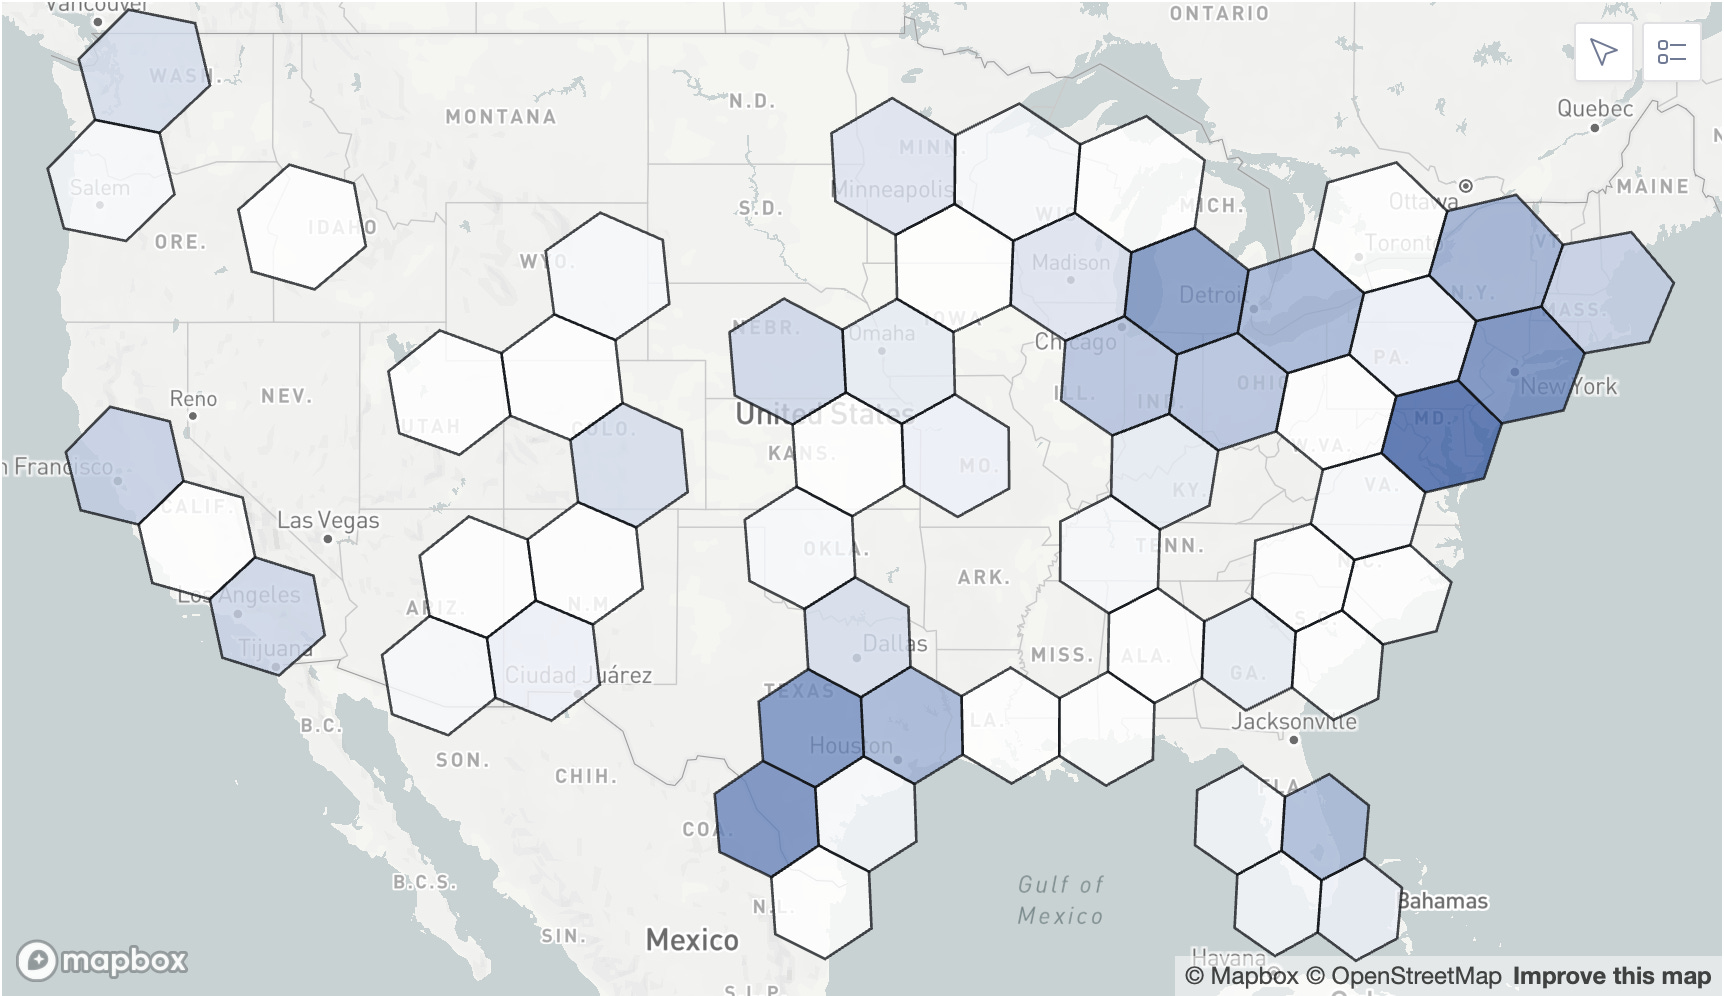
This is just to get a feel of where events mostly took place. We can already pick up 3 areas: New York, Detroit and Houston.
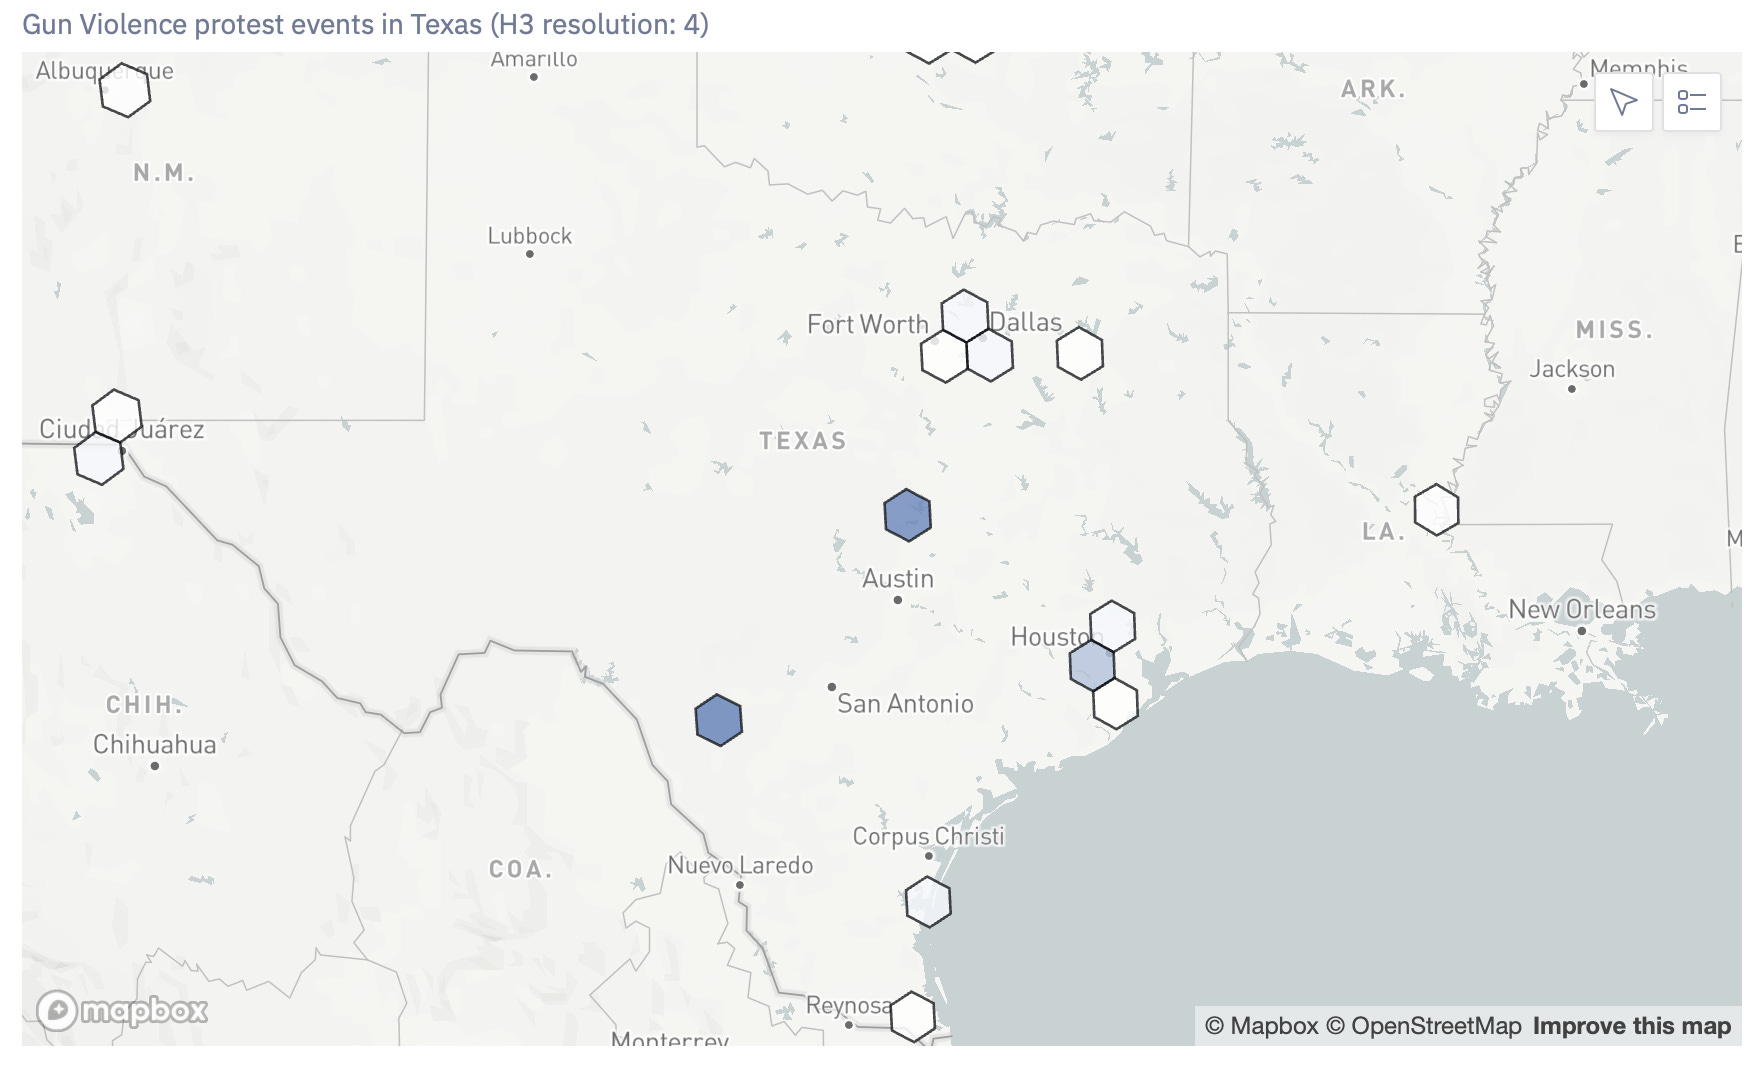
With H3, we can start clustering those events into smaller cells as we are zooming into a specific area. In our case, let’s have a closer look at Texas. For that, we’ll convert our event’s lat/long coordinates into higher-resolution H3 cells.
df_h3_cell_counts_res3 = h3_cell_counts(df_events, my_resolution=3)As you can see, our H3 cells are now covering smaller areas.

Looking into Texas, we notice where protest events were more active.
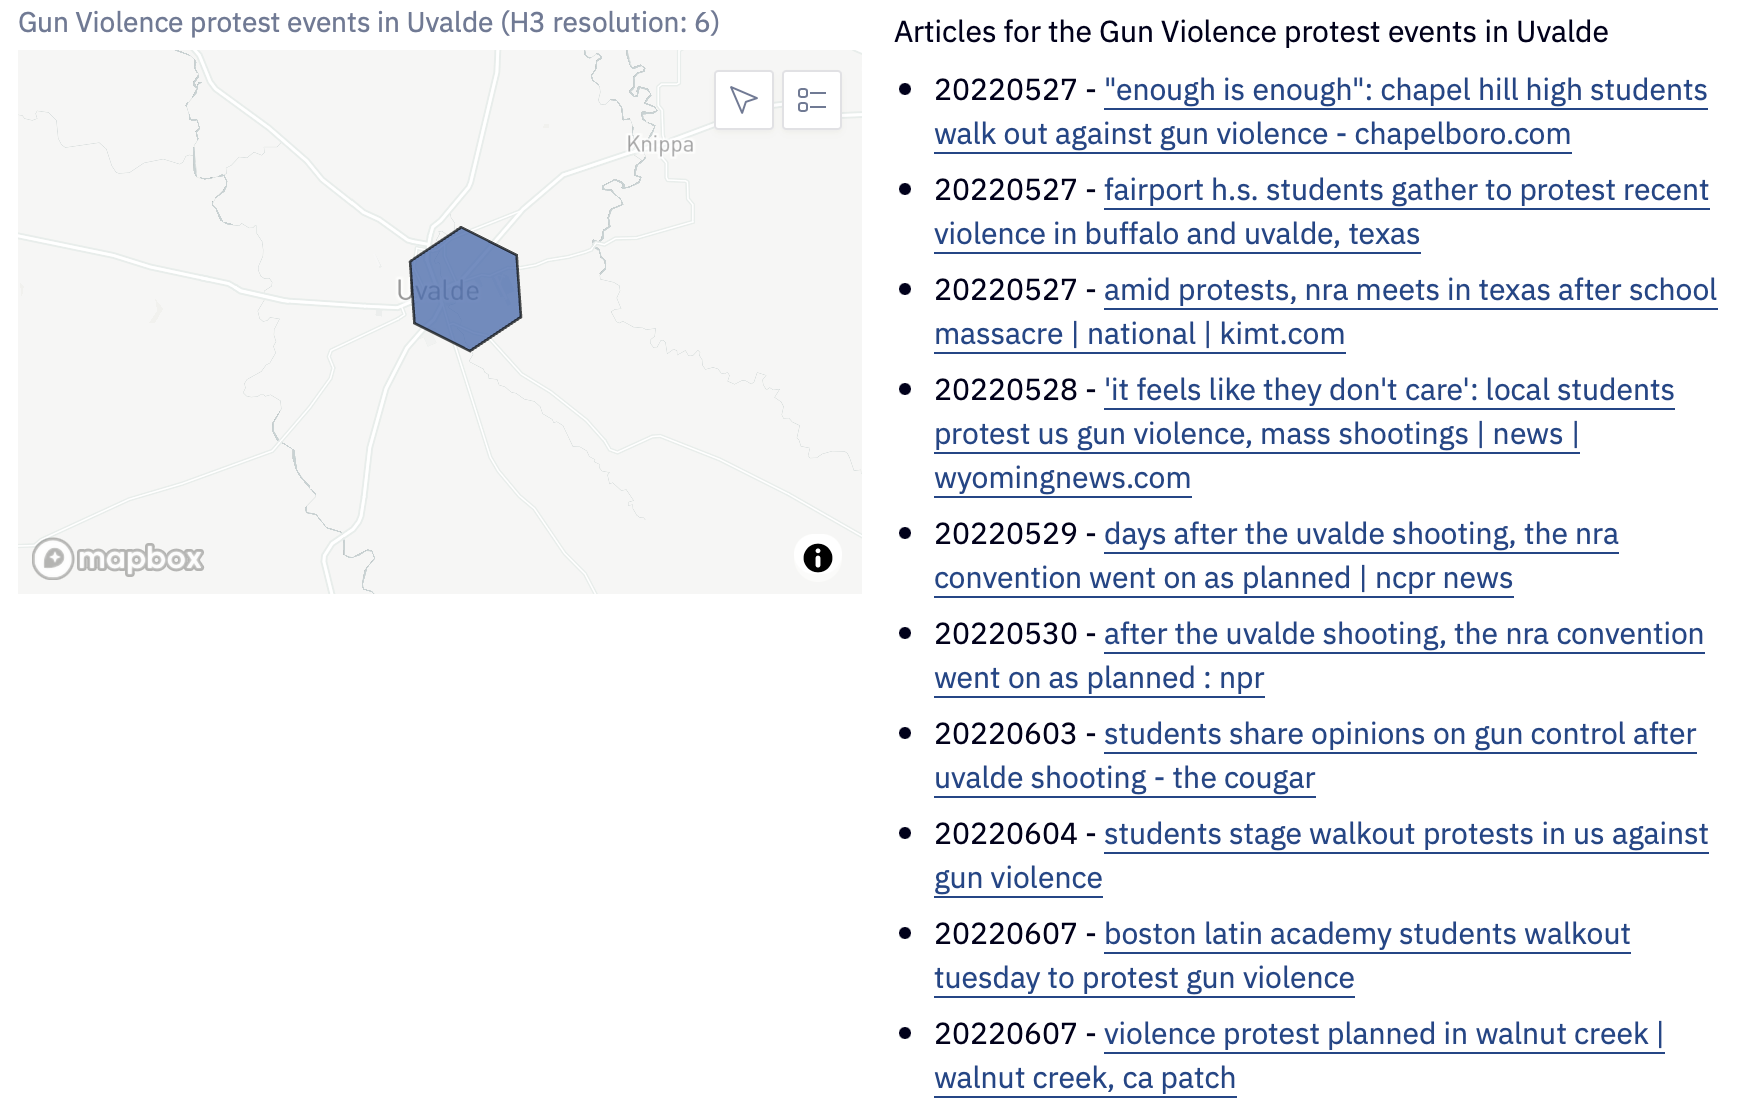
As we zoom in, we can start understanding why those areas are more active when it comes to the Gun Violence protest movement. Sadly, for Texas, the Uvalde school shooting has been a tragic event that sparked outrage from residents (as well as from Texans and Americans).
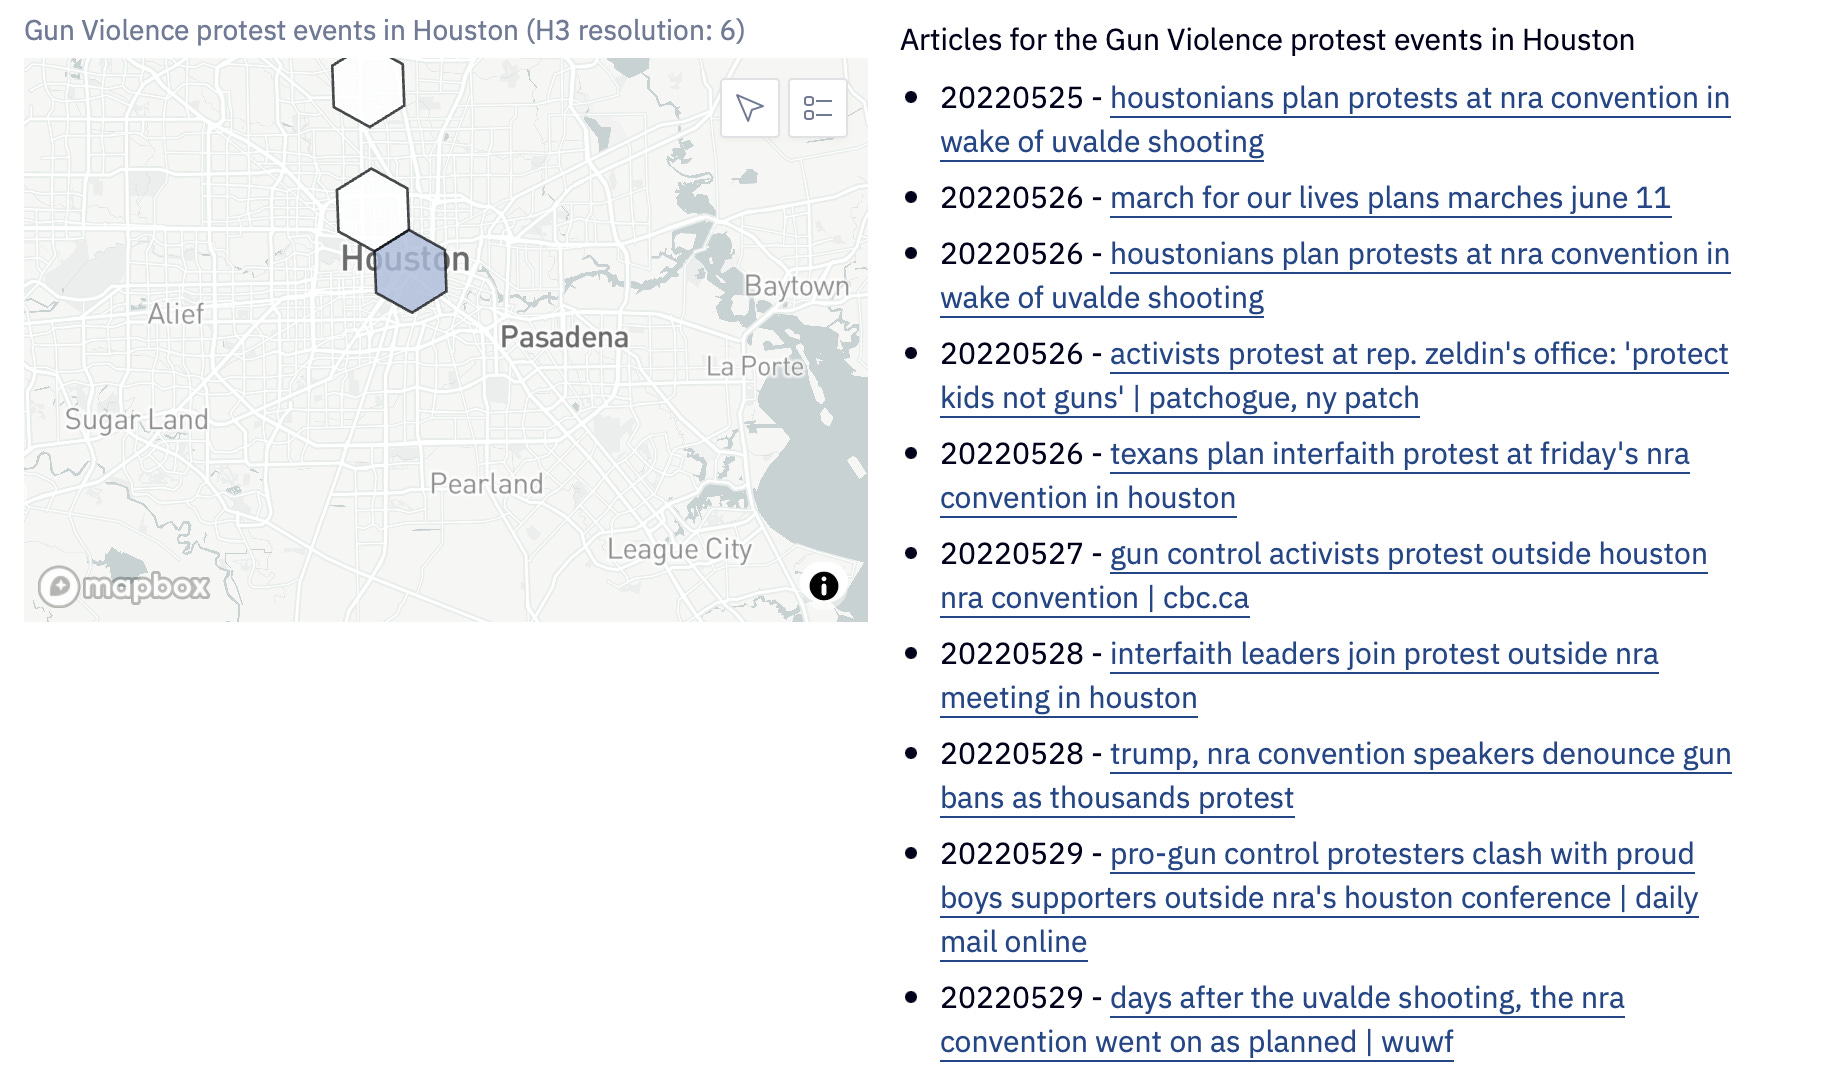
Protests erupted in the Houston area as well as a NRA convention took place just a few days after the Uvalde shooting.
The geography of protest movements holds great importance, as it helps us uncover the myriad stories that come together to form a collective movement. Employing the H3 grid system as a means to cluster and delve into this data offers a powerful method for understanding how significant nationwide movements often originate from local issues that spark citizen mobilization.